Map Catalog Blog

Friday, August 1, 2014

Isotachs

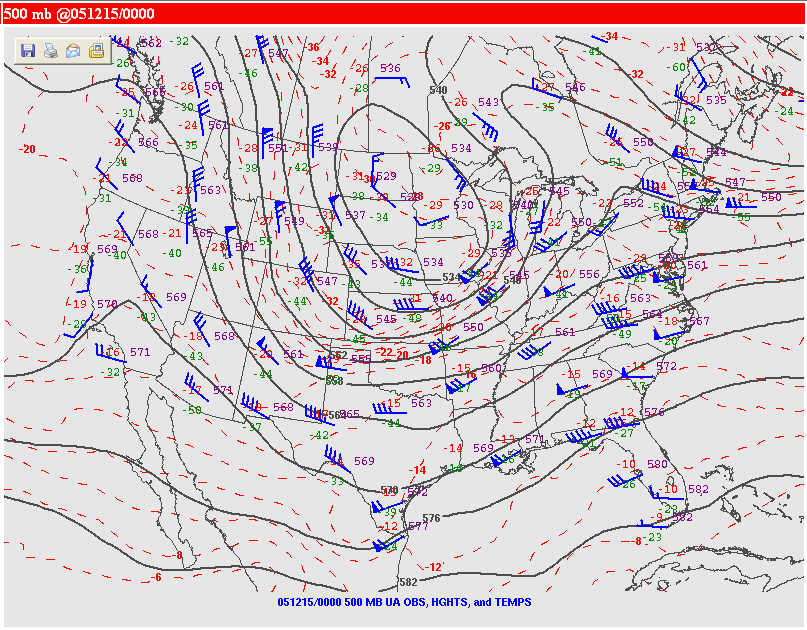
Below is an image of an Isotachs map of the geopotential height and temperature in the United States.  This map type is useful for illustrating equal wind speed points.


http://www.weather.gov/images/gsp/local_research/2005/15Dec_IceStorm/051215_00Z_500mb.jpg
Posted by Unknown at 8/01/2014 10:20:00 AM
Email ThisBlogThis!Share to XShare to FacebookShare to Pinterest

No comments:

Post a Comment

Newer Post Older Post Home
Subscribe to: Post Comments (Atom)

About Me

Unknown
View my complete profile

Blog Archive

  • ▼  2014 (50)
    • ▼  August (36)
      • Star plots
      • Similarity matrix
      • Stem and leaf plot
      • Box plot
      • Histogram
      • Triangular plot
      • Windrose
      • Climograph
      • Population profile
      • Scatterplot
      • Index value plot
      • Bilateral graph
      • Nominal area choropleth map
      • Unstandardized choropleth maps
      • Standardized choropleth maps
      • Univariate choropleth maps
      • Bivariate choropleth maps
      • Unclassed choropleth maps
      • Classed choropleth maps
      • Range graded proportional circle map
      • Continuously variable proportional circle map
      • DOQQ Maps
      • DEM
      • DLG Map
      • DRG Map
      • Isopleths
      • Isopach
      • Isohyets
      • Isotachs
      • Isobars
      • LIDAR Map
      • Doppler radar
      • Black & white aerial photo
      • Infrared aerial photo
      • Cartographic animations
      • Statistical map
    • ►  July (10)
    • ►  May (4)
Simple theme. Powered by Blogger.