Map Catalog Blog

Friday, August 1, 2014

Windrose

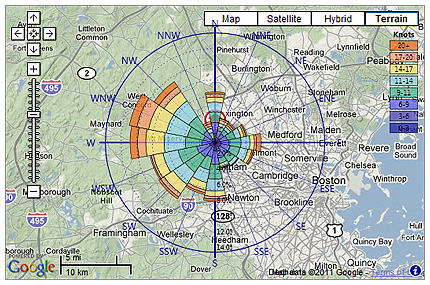
Below is an image of a Windrose map over the area of Massachusetts near Boston that illustrates wind speeds.  This map type is useful for illustrating the wind speeds over a specific area and time period.


http://help.autodesk.com/cloudhelp/B3/ENU/Vasari-UsersGuide/images/GUID-14FE53F4-D212-461D-8AA6-1471D57F7BD6.png
Posted by Unknown at 8/01/2014 01:05:00 PM
Email ThisBlogThis!Share to XShare to FacebookShare to Pinterest

No comments:

Post a Comment

Newer Post Older Post Home
Subscribe to: Post Comments (Atom)

About Me

Unknown
View my complete profile

Blog Archive

  • ▼  2014 (50)
    • ▼  August (36)
      • Star plots
      • Similarity matrix
      • Stem and leaf plot
      • Box plot
      • Histogram
      • Triangular plot
      • Windrose
      • Climograph
      • Population profile
      • Scatterplot
      • Index value plot
      • Bilateral graph
      • Nominal area choropleth map
      • Unstandardized choropleth maps
      • Standardized choropleth maps
      • Univariate choropleth maps
      • Bivariate choropleth maps
      • Unclassed choropleth maps
      • Classed choropleth maps
      • Range graded proportional circle map
      • Continuously variable proportional circle map
      • DOQQ Maps
      • DEM
      • DLG Map
      • DRG Map
      • Isopleths
      • Isopach
      • Isohyets
      • Isotachs
      • Isobars
      • LIDAR Map
      • Doppler radar
      • Black & white aerial photo
      • Infrared aerial photo
      • Cartographic animations
      • Statistical map
    • ►  July (10)
    • ►  May (4)
Simple theme. Powered by Blogger.